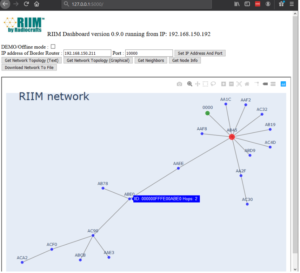
Radiocrafts is excited to announce the release of the RIIM Dashboard! The RIIM Dashboard is a tool used to analyse and monitor an active RIIM network. It allows the user to monitor the link quality between nodes during installation and operation.
The RIIM Dashboard is a stand-alone application capable of:
- Retrieving the RIIM network topology
- Graphically and interactively showing the network
- Retrieving the neighbour table of the Border Router, showing the RSSI of the links to the other nodes
- Retrieving the Node information of the Border Router, including the IP addresses and PAN ID
- Saving the current network state to CSV files for later analysis in e.g. MS Excel
- Connecting to any IPv4 address and Port
The RIIM Dashboard is interactive and runs in a web browser as it creates its own local web server. It can also be run in OFFLINE / DEMO mode if it is not connected to a Border Router.
Connecting the RIIM dashboard to the RIIM network is easy! All you need to do is connect both the RIIM Dashboard and Border Router through the same network switch. You then setup the Border Router to open a connection to the outside world via the ICI framework. Finally, in the RIIM Dashboard, you will want to enter the IP address and Port number of the Border Router, and you are done!
You download the RIIM Dashboard here.
You can download the RIIM Dashboard User Manual here.
You can read more about the RIIM Dashboard here.


